Fractal Model [Pro+] (TTrades)
Crafted with TTrades, the Fractal Model empowers traders with a refined approach to Algorithmic Price Delivery. Specifically designed for those aiming to capitalize on expansive moves, this model anticipates momentum shifts, swing formations, orderflow continuations, as well as helping analysts highlight key areas to anticipate price deliveries.

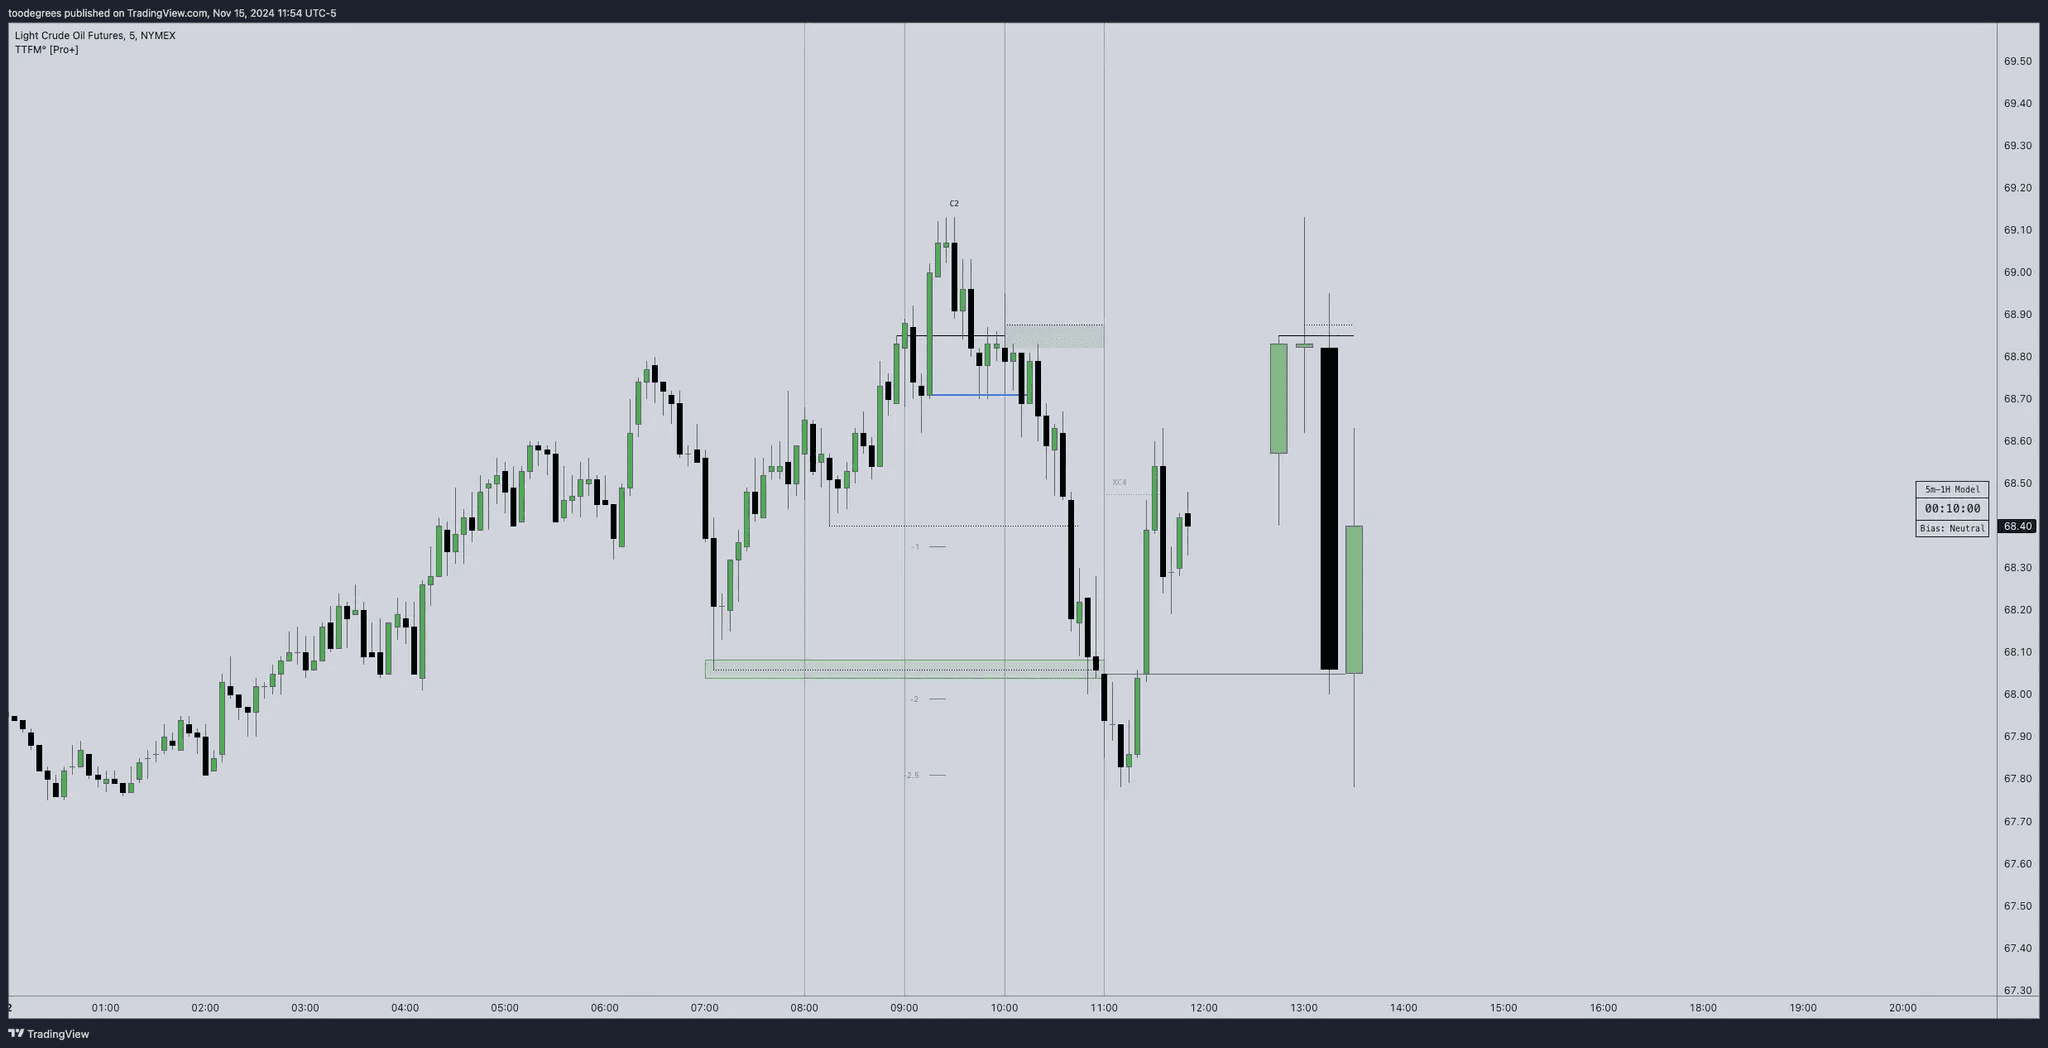
Fractal Model° [Pro+]
Concept Introduction
Crafted with TTrades, the Fractal Model empowers traders with a refined approach to Algorithmic Price Delivery. Specifically designed for those aiming to capitalize on expansive moves, this model anticipates momentum shifts, swing formations, orderflow continuations, as well as helping analysts highlight key areas to anticipate price deliveries.
The Fractal Model° [Pro+] is rooted in the cyclical nature of price movements, where price alternates between large and small ranges. Expansion occurs when price moves consistently in one direction with momentum. By combining higher Timeframe closures with the confirmation of the change in state of delivery (CISD) on the lower Timeframe, the model reveals moments when expansion is poised to occur.

Thanks to TTrades' extensive research and years of studying these price behaviors, the Fractal Model° [Pro+] is a powerful, adaptive tool that seamlessly adjusts to any asset, market condition, or Timeframe, translating complex price action insights into an intuitive and responsive system.
The TTrades Fractal Model remains stable and non-repainting, offering traders reliable, unchanged levels within the given Time period. This tool is meticulously designed to support analysts focus on price action and dynamically adapt with each new Time period.
Indicator Features
Custom History
Control the depth of your historical view by selecting the number of previous setups you’d like to analyze on your chart, from the current setup only (0) to a history of up to 40 setups. This feature allows you to tailor the chart to your specific charting style, whether you prefer to see past setups or the current view only.

Fractal Timeframe Pairings
This indicator enables users to observe and analyze lower Timeframe (LTF) movements within the structure of a higher Timeframe (HTF) candle. By examining LTF price action inside each HTF candle, analysts can gain insight into micro trends, structure shifts, and key entry points that may not be visible on the higher Timeframe alone. This approach provides a layered perspective, allowing analysts to closely monitoring how the LTF movements unfold within the overarching HTF context. For a more dynamic and hands-off user experience, the Automatic feature autonomously adjusts the higher Timeframe pairing based the current chart Timeframe, ensuring accurate alignment with the Fractal Model, according to TTrades and his studies.

Bias Selection
This feature allows analysts complete control over bias and setup detection, allowing one to view bullish or bearish formations exclusively, or opt for a neutral bias to monitor both directions. Easily toggle the bias filter on Fractal Model to align with your higher Timeframe market draw.

Timeframe Pairing Limitations
This indicator supports Timeframe pairings (e.g., 5m-1H, 15m-4H). If you select a timeframe, greater than the lower Timeframe (LTF) view (e.g., viewing a 15m chart when 5m-1H is enabled), the indicator will display an warning message within the table. Although the higher Timeframe (HTF) candle plotting will remain visible, note that the LTF’s CISD and associated projections will not render in this view.
Customizable Time Filters
Further synchronize Time and price studies by selecting up to three custom Time windows, filtering model formations that fall outside these specified ranges. This provides clarity and focus on relevant price action signatures within defined Time windows, at the discretion of the analyst.

Higher Time Frame Candles (PO3)
The Fractal Model° [Pro+] integrates the HTF Power of Three [Pro+] framework, enabling traders to visualize and spot critical turning points live. By incorporating this structure, traders can observe key phases of price delivery and market transitions on lower Timeframes, while monitoring higher Timeframe candle development.

NEW Feature! - Custom HTF Candle Lookback History
Defines how many HTF candles are plotted on the chart. Increasing the value provides more historical structure and a broader view of swing development. Lower values keep the focus on the most recent expansion.

Info Table
Display a customizable information table that includes key details such as timeframe pairing, Time until the next higher Timeframe candle close, analyst bias, and applied Time filter preferences. Options for size, location, and border give analysts full control over the table’s appearance on the chart.
TTrades Framework Customization
TTFM Lables (C2/C3/C4): When a setup remains valid, the label will display in gray, signifying stable conditions for the setup. If the setup fails (defined by price returning to the initial high or low without forming a higher Timeframes swing point) the indicator will stop plotting projections, Equilibrium (EQ), Liquidity Sweep, and the T-spot.
In this case, the labels for key points (C2, C3, C4) will remain on the chart but turn red, clearly indicating the failure of the setup. If the setup does not fail within the next higher Timeframes candle, which defines the setup’s formation, the label will turn orange.
This orange color signals potential consolidation, or slowdown, suggesting that the market may enter a range or pause in trend movement within the setup.

Candle 1 Liquidity
Highlight important liquidity levels at each swing point with horizontal rays, marking sweeps of liquidity and potential reversals.

Change in State of Delivery (CISD)
Mark the series of candles making up significant highs or lows. A close beyond the opening price signals a change from bullish to bearish or vice versa, confirming a trend reversal.

Candle Equilibrium
Indicates 50% levels of higher time frame ranges, displaying discount and premium zones that provide additional context for potential entries and exits.

T-Spot Identification
The T-Spot marks anticipated points of the higher Timeframe candles where price wicks are expected to form, based on TTrades’ refined analysis and methodology. This level is invaluable for identifying high-probability reversal or continuation points within lower Timeframes, remaining aligned with the higher Timeframe narrative.

Projections
Leverage projected levels based on the shifts in delivery as per TTrades’ analysis. These user-defined levels serve as future points of interest for price to redeliver, rebalance, and exhaust. Analysts can add, or remove, desired projection levels – default projections being [-1, -2, -2.5, -4, -4.5].
Body Projections:

Wick Projections
Wick projections:

Formation Liquidity
Identify previous candles' highs and lows as critical liquidity points appertaining to the current developing formation. These zones are marked to provide easy visualization of engineered liquidity pools, serving as key reference points for future price action.
Fully Automated Framework
All these components, when put together in the Fractal Model° [Pro+], yield TTrades' fully automated system. Each component is customizable to the analyst's liking to match their unique visual preferences and model Timeframes.

Alerts Setup
Enables the Alerts.
To turn on alerts, follow these steps:
Make sure the ‘Alerts’ toggle is ON, and your preferred alerts are selected below.
Find, and click on, the three dots next to the indicator title on the top left of your chart, or right-click on the indicator on the chart.
Click ‘TTFM [Pro+]’
Choose the symbol or pre-defined watchlist.
Choose the Alert Name, if you wish, and confirm by clicking ‘Create’

HTF Candles
Candle Size
Adjust the size of higher timeframe candles to suit your chart layout, making larger trends more visible.

Offset
Adjust the position of higher timeframe candles on the chart. Enter a positive value to shift the candles to the right or a negative value to shift them to the left. This flexibility helps you align HTF candles relative to lower timeframe data, providing clearer insights without clutter.
Visibility Toggle
Option to hide or display higher timeframe candles for a cleaner view or detailed multi-timeframe analysis.
Body, Border, and Wick Colors
Customize colors for each candle component to distinguish HTF structures clearly within your chart setup.

Marker Options
Enable open/close markers and high/low lines for HTF candles, with customizable line styles and widths for added clarity.
Previous candle EQ
It’s now possible to customize the Previous Candle EQ settings. This is for the HTF Candle model. For example, when selecting the 1H/5m model, it will display the previous 1H Model EQ, this can be viewed both on the HTF candle and the chart directly.

General Settings
Alerts
Toggle alerts for key setup conditions, enabling notifications for critical moments based on your settings.
Here at Toodegrees, we aim to help you save time in your analysis. To setup alerts, follow these easy steps:
Make sure your Alerts tab is toggled with a check mark
Head Over to the Indicator Name and Click the 3 Dots that reads “More”
After clicking the 3 Dots, a menu will pop up where you would like to hover over and select “Add Alert”
After selecting “Add Alert”, a new popup will then appear where you will see your TTrades Fractal Model settings confirmed with related inputs.
Analyst Insight: This alert function helps analysts to manage their time accordingly. By enabling alerts analysts are able to look at other markets or perform other tasks while making sure to not miss a setup.

History Setups
Control the number of past setups visible on your chart, from current setup only to up to 40 historical setups, allowing for historical context.
Analyst Insight: Enabling historical setups does not only allow the analyst to view to context of the previous setups, but can also aid when collecting data on the model.
Fractal Pairing
Choose timeframe pairings (e.g., 1H-1D) to align lower timeframe analysis within the structure of a higher timeframe.
Custom Fractal Pairing
Custom: Choose your own custom fractal pairing, make sure the ‘Fractal’ setting is set to ‘Custom‘

Bias Selection
Set a market bias to focus on bullish, bearish, or neutral setups, allowing you to filter for directional trades or monitor both sides of the market.
NEW Feature! - Autobias Feature
Auto Bias 1 → Aligns fractal models with one timeframe higher than the current chart.
Auto Bias 2 → Aligns fractal models with two timeframes higher than the current chart.

Time Filters
Specify a timeframe threshold below which time filters will be applied, helping you narrow down relevant sessions.

Time Filter
Define up to three custom time filters (e.g., 02:00 - 05:00, 08:00 - 11:00), targeting specific trading sessions or hours for focused analysis.
Custom Timezone
Custom Timezone: Define your custom timezone based on UTC. The default timezone is New York Eastern Time.

Model Style
Show TTrades Fractal Model Labels

Choose whether to display model labels (C2, C3, C4) and adjust the label size to keep key points visible.
Candle 1 Sweep
Style the Candle 1 Sweep marker, adjusting line type and width to highlight this initial liquidity marker.
Change in State of Delivery (CISD)
Customize CISD lines to mark significant shifts in delivery, signaling potential trend changes.
Analyst Insight: The Change in State of Delivery (CISD) is an form of orderblock that signifies the first potential change in orderflow. Going from a sell program towards a buy program or vice versa.
Candle Equilibrium
Display equilibrium points at 50% of HTF ranges to assist in identifying premium and discount zones.
Analyst Insight: Within ICT’s methodologies there is a common ground rule, the best short setups form inside the premium end of the range, and the best long setups form inside the discount end of the range. Buying when it’s cheap, and selling when it’s expensive.
T-Spot Indicator
Enable and style the T-Spot marker to highlight anticipated wick points on HTF candles, aiding in identifying high-probability price areas.
Analyst Insight: The T-Spot is a tool that projects the potential area where the wick of the new candle forms.
NEW Feature! - Early CISD
A new option called Early CSD has been added. When enabled, it highlights the early Change in State of Delivery (CISD) within the C2 candle. This allows users to observe potential shifts in delivery state earlier in the model sequence.


NEW Feature! - SMT Divergence
The SMT Divergence module allows you to detect divergences between correlated or inversely correlated markets directly within the Fractal Model.

Show SMT?
Toggles the SMT lines on/off.
Alerts?
Enables alerts when a divergence is detected. Alerts must be setup for this setting to
SMT Pair Selection
You can manually select two markets to compare (e.g., CME_MINI:ES1! and CME_MINI:YM1!).
Inverse? → Use this if the selected market has an inverse correlation to the chart’s main asset. Note: If Auto SMT and Inverse are both enabled, the inverse setting will be ignored.

Automatic SMT Pair Detection
When enabled, the system automatically selects the most relevant SMT pair for the charted asset, removing the need for manual setup.
Line Style & Width
Customize the SMT line color, thickness, and style.
Labels
Display divergence labels on the chart (choose size: Tiny → Huge).
Orderblock Projections and Style
Projection Levels
Enable future price projection levels based on past orderblock behavior, helping to identify potential price responses.

Label Visibility
Choose to display labels for each projection level, providing clarity on each identified orderblock point.

Label Styling
Customize label size, style, and color to ensure projected levels are distinguishable on the chart.
Formation Liquidity
Liquidity Markers

Highlight critical liquidity zones from previous highs and lows, marking engineered liquidity pools that can influence price.
Line Style and Width
Customize the appearance of liquidity markers, choosing between dotted or solid lines, and adjust line thickness for visibility.
Fractal Model Info Table
Table and Info Customization
Choose to view the Fractal Model information in Table form, or On Chart below the HTF Candles.
Customize the table’s position, size, and whether to have the borders of table cells for convenient visualization to the data.

Information Details
Choose specific details to display in the info, such as Fractal pairing, Time to Close, Bias, and applied Time Filters, ensuring that relevant insights are available at a glance.


Get Access to this script here!
P.S. We appreciate you reading our tool manual! Your feedback is invaluable in helping us grow to strengthen our community. Please let us know in Discord any way we can improve!
Take 10% off your first billing using code FEATURES10.